- Flag Breakout on weekly charts with expected target of 35% in next few months.
- 13wMA above 20wMA and 20wMA above 50wMA and all these MA are above 100wMA - Positive for short and medium term.
- Support near 50wMA 2460.
Join Our Free Telegram group
- Kitex Garment Stock is in downtrend for long term but has taken support from 200-190 range multiple times during last 1 year.
- Stock is making descending triangle pattern and require a breakout for any major move.
- On Friday stock made Bullish Engulfing Pattern from supporting range. We are expecting the positive trend to continue.
- Minor resistance 207-12-20, Major resistance 240. Support below 190 are 180-63-50.
Join Our WhatsApp group
- Longs were advised to clients/Followers when stock was at 192-92 last week (Option Trade No.10 dated 11.11.2022) now stock has completed our first target 197.
- Stock is looking good for targets of 215 (10%) as has given neckline breakout from inverted head and shoulder on daily chart.
- Stock has crossed and sustained above 50dMA indicating further upside. Short term (13dMA) has shown cross over above 20dMA.
- Descending triangle pattern breakout on weekly chart.
- Indicators -ADX on daily chart. RSI, William %R on weekly chart showing fresh buying interest.
To Join our qoohoo group click on the link below
- Jupiter wagons is a newly listed company and it's stock is performing great since listing.
- On daily chart a Cup and Handle Pattern breakout is visible. with expected targets of 20% and above from neckline breakout level.
- Support exists at 76 while best entry will be on sustaining at 82.
- Technical indicators William % R, RSI are in buying mode
Open IIFL demat Account
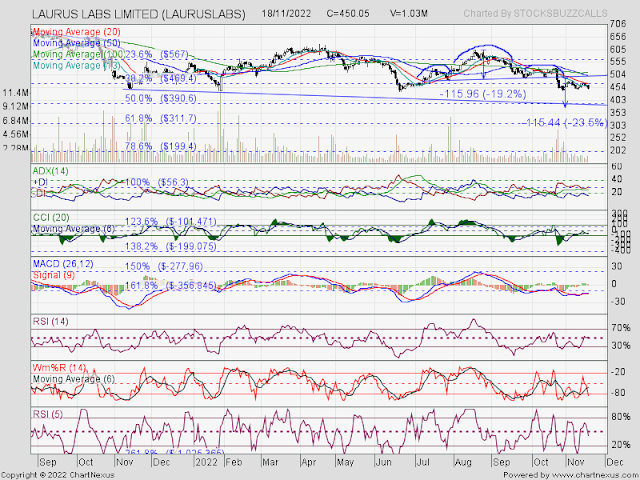
- With all pharma sector stocks this stock is also in downtrend.
- Stock is taking support around 440 but when we check chart pattern on last 6 month chart it is easily visible that a head and shoulder pattern neckline breakdown has already happened and once stock breaks 440-35 (previous low) another decline of 10-15% is on cards.
- Technical Indicators RSI(5), William %R , ADX are indicating further weakness in stock.
- 20dMA cross over above 13dMA and 100dMA cross over above 50dMA indicating weakness to continue for some more time


