During last 4 months we shared almost 20-25 Stocks with detailed technical analysis in our posts. Now we are sharing the performance and updates on the same. Hope you enjoyed the calls based on our technical analysis. If you are also interested in learning technical analysis with us, you can contact us on whatsApp /Twitter/ Facebook/ Telegram@(+91) 7737093555

Stock Hit 485, Stay Invested for targets mentioned in previous post.
Stock Hit 258 to 270, Stay Invested for targets mentioned in previous post.
Stock Hit 96 to 99, Stay Invested for targets mentioned in previous post.
Stock Hit 289 to 315, Stay Invested for targets mentioned in previous post.
Stock Hit 882 to 914, Stay Invested for targets mentioned in previous post. Use dips to add with Stoploss mentioned.
Stock Hit 369 to 393+, Stay Invested and add more for targets mentioned in previous post.
Stock Hit 633 to 836 after our recommendation in January,2024 completing all our targets. .Stock is still looking good and can test 900 soon. Stay interested.
Stock Hit 140 to 164 completing our initial targets. Fresh entry only above 170

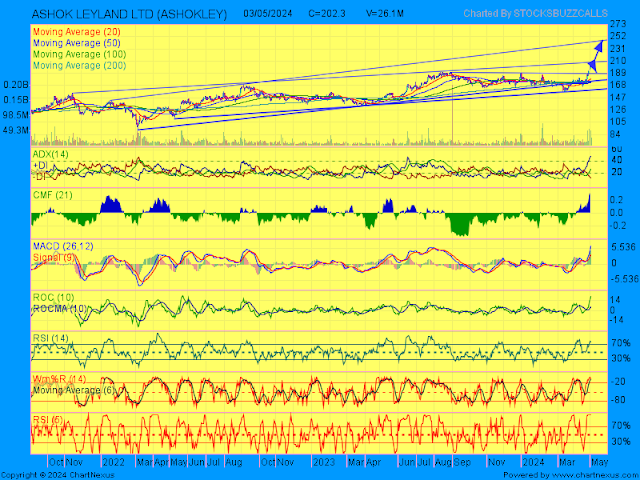
Ashok Leyland Stock completed our initial target of 204 (Hit 205) Book Profits. Fresh longs above 210 for 250. Support 189. Have a look at daily chart

Stock completed our initial targets (Hit 1175+) and also made bullish pattern called cup and handle pattern, But Neckline breakout is yet to be confirmed. So wait and make fresh entry only on close above 1180. Target can be increase to 1360 from 1330. Support 1125. Have a look at updated chart

Completed both our targets and No fresh entry is advisable till the stock closes and sustains above shown major trendline resistance.
Stock Hit 83 to 193 in last one year after our recommendation in our you tube video dated 30-4-2023 and 148 to 193 in last 2 month after our march blog post.
What Next? Looking at bigger timeframe ( Monthly charts) shows bullish inverted(Bottom) Head & Shoulder pattern breakout with medium term targets of 245 and above, Add above 195 or on dips near 175 with stop below 169.
Stock Hit 115 to 145 in last 2 months completing both our short term targets. What Next ?
Now the stock is showing bullish inverted(Bottom) Head & Shoulder pattern as well as symmetrical triangle pattern breakout on daily charts with short to medium term targets of 177 (previous high). Above 177 stock may test 250 in medium to long term. Add fresh only above 145. Stop 125.


%20LIMITED-800x600.png)


