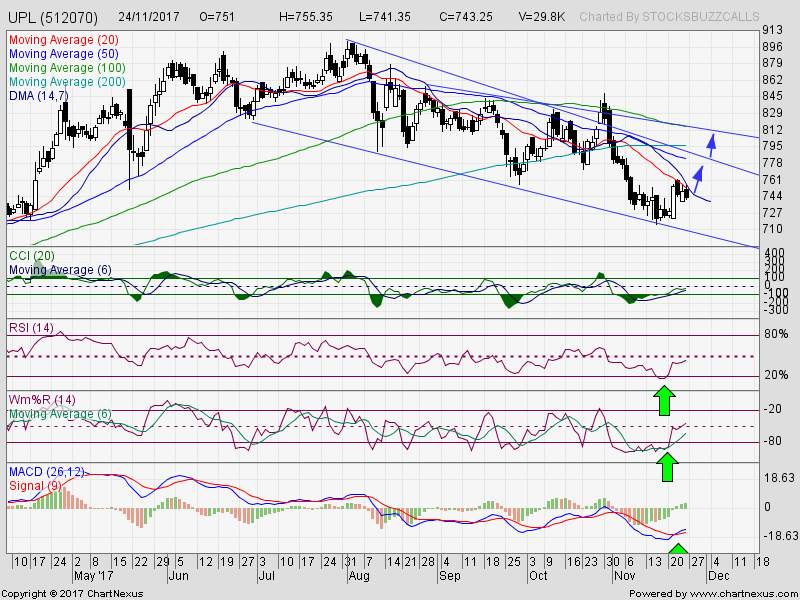
Stock is in downtrend and has already corrected significantly in last 3 months from the highs of 902 to the levels of 716. Stock, trading in a downward range, found good support near 715. Have a look at daily chart :

As per weekly and monthly charts also, the stock is looking good. On weekly charts Stock has formed a Bullish Engulfing Pattern which indicates end of current downtrend in stock. Technical indicator RSI 5 is looking in oversold zone and William %R is showing positive divergence. Have a look at weekly chart.

As per weekly and monthly charts also, the stock is looking good. On weekly charts Stock has formed a Bullish Engulfing Pattern which indicates end of current downtrend in stock. Technical indicator RSI 5 is looking in oversold zone and William %R is showing positive divergence. Have a look at weekly chart.


